

Abstract
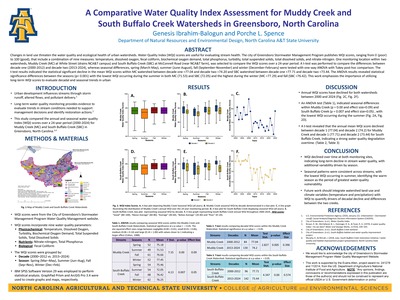
Changes in land use threaten the water quality and ecological health of urban watersheds. Water Quality Index (WQI) scores are useful for evaluating stream health. The city of Greensboro Stormwater Management Program publishes WQI scores, ranging from 0 (poor) to 100 (good), that include a combination of nine measures: temperature, dissolved oxygen, fecal coliform, biochemical oxygen demand, total phosphorus, turbidity, total suspended solids, total dissolved solids, and nitrate-nitrogen. One monitoring location within two watersheds, Muddy Creek (MC) at White Street (drains NCA&T campus) and South Buffalo Creek (SBC) at McConnell Road (near NCA&T farm), was selected to compare the WQI scores over a 24-year period. A t-test was performed to compare the differences between decade one (2000-2012) and decade two (2013-2024), whereas seasonal differences, spring (March-May), summer (June-August), fall (September-November) and winter (December-February) were tested with one-way ANOVA with Tukey post-hoc comparison. The t-test results indicated the statistical significant decline in the mean WQI scores within MC watershed between decade one =77.04 and decade two =74.20 and SBC watershed between decade one =77.71 and decade two =73.44. The ANOVA results revealed statistical significance differences between the seasons (p< 0.001) with the lowest WQI occurring during the summer in both MC (71.53) and SBC (72.05) and the highest during the winter (MC =77.29) and fall (SBC =76.42). This work emphasizes the importance of utilizing long-term WQI scores to evaluate decadal and seasonal trends in urban
Preview
Publication Date
Spring 2026
Faculty Mentor
Dr. Porche L. Spence
Department
Department of Natural Resources and Environmental Design